The 3rd Quarter, Hamptons Homes Sales Report, was akin to watching a collection of super balls bouncing in all different directions simultaneously. That said, analyzing, the data for these 3 months in this year to year comparison, yields some important insights.
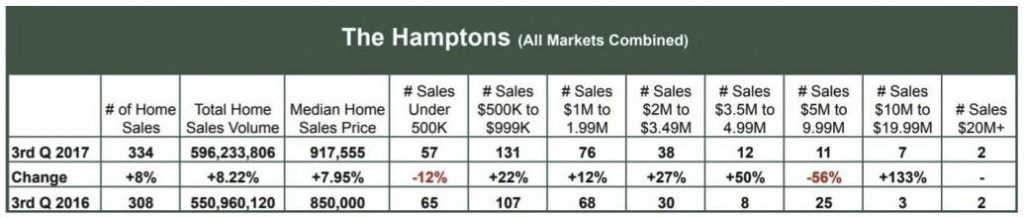
The most glaring of which is that the $10-$20M price range found its groove again — whew — with 133% year over year explosion from 3 in 2016 to 7 in 2017, 3rd quarter. The kicker is 6 of the 7 home sales $10-20M were in the Bridgehampton area (which includes Water Mill and Sagaponack) – 2 in Bridgehampton, 1 in Sagaponack and 3 in Water Mill. A dazzling statistical fact; Bridgehampton area (which includes Water
Mill and Sagaponack) accounted for over 26% of the Total Home Sales Volume for the entire region! $158M of the $596M posted for the 3rd Quarter.
Both of the 2 sales over $20M occurred in East Hampton Village — no surprise there, as East Hampton’s Estate section, historically, posts the high watermark most years. But 2017 won’t shatter the ceiling as these two sales were “only” $29M (11 Lily Pond Lane) and $25.925M (81 Briar Patch). A far cry from the prior ceilings of well over $100M.
East Hampton Village posted the highest Median Home Sales Price at $4,437,500. impressive, yet 15% less than last year’s at $5.25M. Leaps and bounds over the next highest Median Home Sales Price in Bridgehampton area (which includes Water Mill and Sagaponack) at $2.71M.
On the dark side, Sag Harbor area (which includes Noyack and North Haven) went out to sea for three months! The Number of Home Sales tanked by nearly 30% and the Total Home Sales Volume sank like an anchor at nearly 60%. Closer scrutiny over the 8 price categories monitored by TOWN & COUNTRY and clearly you see why…there were no sales $5M and up. None, zero, zip!
Collectively, we know why sales under $500K went down —there simply are few to none — but why the $5-10M price range dropped 56%, from 25 in 2016 to 11 in 2017, needs to be explored further.
In closing, looking at All Hamptons Markets Combined and we see the 3rd Quarter was a healthy quarter for Hampton Home Sales. There were approximately 8% increases in all 3 criteria monitored by TOWN & COUNTRY — Number of Home Sales, Total Home Sales Volume and Median Home Sales Price.
To view all reports click here – http://www.townandcountryhamptons.com/html/marketReports.php